San Francisco Housing Development Report
San Francisco New-Housing Construction Trends Within its 49 square mile envelope, San Francisco is already the 2nd most densely populated city in the United States, and it's growing denser, more affluent and more expensive.
The charts included are mostly based on the San Francisco Planning Department’s excellent Housing Inventory and Pipeline reports, which can be accessed using the links at the bottom of this article. Quotes below are excerpted from these reports.
Packed with information, the data in one report section will not always agree perfectly with that in another – due to the multiple sources of data used by the Planning Department – and this is reflected in our charts as well. In the complex, lengthy process of new-housing application and review, public hearings (and, lately, ballot proposals), revisions, entitlement, permitting, construction and completion, how and when a project is counted may vary. Housing units are being built and being removed, and there are so many types: rental or sale, market rate or affordable, social-project housing or luxury condominiums.
Last but not least, this landscape is in constant flux - new projects, plan changes, and shifts in economic and political realities. Everything below is simply a good faith estimate. The basic reality is that San Francisco, after its recent 2008-2012 new-construction slump, is now experiencing a building boom. So far, however, it has not been able to keep up with population growth and rising buyer/renter demand.

New construction authorized typically will not show up as housing units completed until later years. And, of course, a developer can decide not to build after authorization if market circumstances change. The post-2008 drop in authorizations is clearly illustrated here.
“Some of the larger projects completed in 2013 include: 1190 Mission Street (355 market-rate units and 63 affordable units), Rincon Green (277 market rate units and 49 affordable units), Nema (279 market rate units and 38 affordable units).”
“Very large projects (200 units or more) filed in 2013 and are under Planning Department review include: Mission Rock (1,500 units); 150 Van Ness Avenue (429 units); 41 Tehama Street (398 units); 1066 Market (330 units); 950 Market Street (316 units); and 1301 16th Street (276 units).”
Besides the above projects, rarely a week goes by in which new commercial property sales aren't being announced – such as the Honda dealership lot and the KRON Building, both on Van Ness – with plans for large-scale residential development projects.
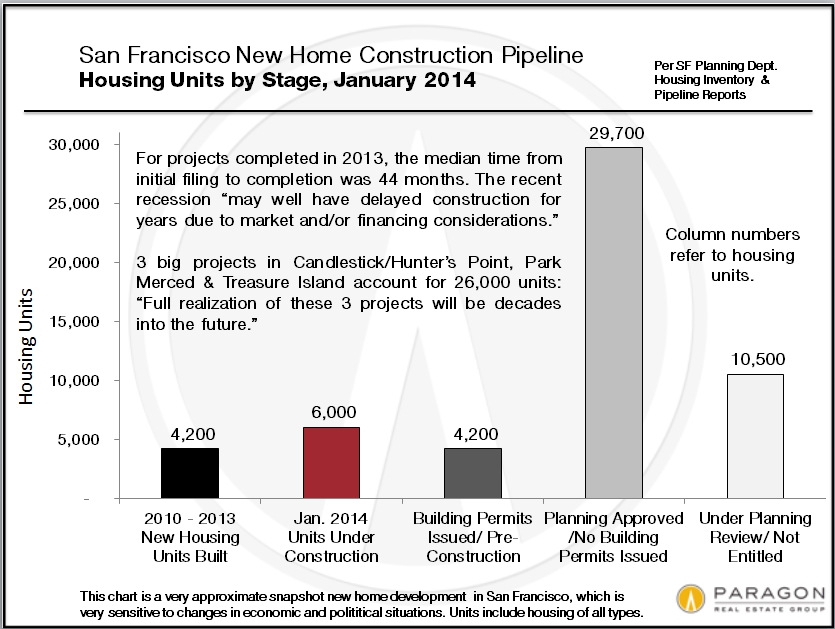
A glance at the recent past, the present and the possible future of new housing construction in the city. New projects are continually entering and moving through the pipeline, and existing plans may be changed or even abandoned.
“There are currently 857 projects in the pipeline. Of these, 74 percent are exclusively residential and 17 percent are mixed-use projects with both residential and commercial components. Only 8 percent of projects are non-residential developments. A net total of 50,400 new housing units would be added to the city’s housing stock according to current data. Around 18 percent of all projects, representing 6,000 net added housing units and 2,750,000 sq. ft. of commercial space, are under construction. Around 20 percent of projects (with another 4,200 net units and 3,8 million sq. ft. of commercial space) have received building permit approvals. As of the time of writing, some may have moved to the construction phase.”
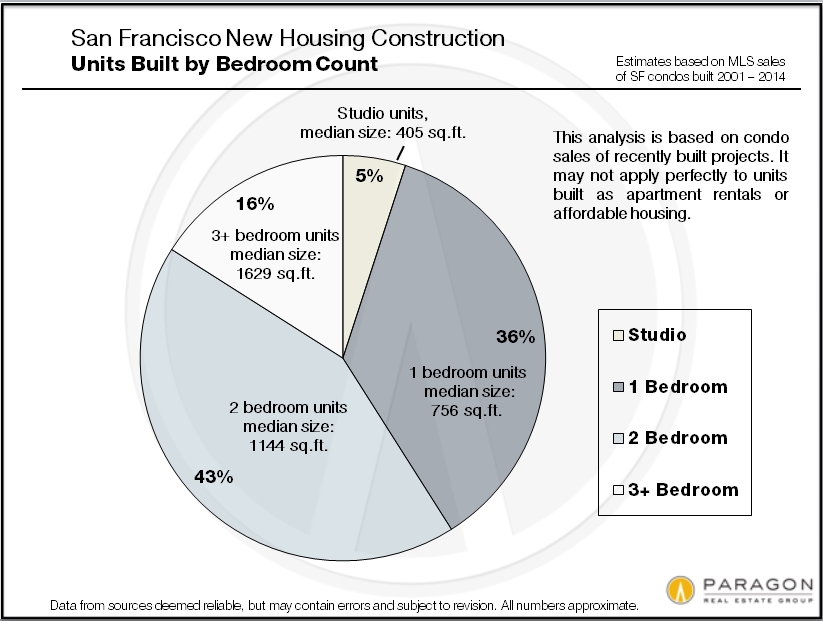
We haven’t found an easy place for construction data by unit size, so this chart is extrapolated from the last 7 years of SF MLS sales of condos built 2001 -2014. It may not apply perfectly to units built as apartment rentals or affordable housing.
Typically, the smaller the unit, the higher the dollar per square foot value on sale or rental, however in San Francisco, 3+ bedroom condos are often high-floor units with spectacular views that sell for extraordinary sums – but these would be outliers to the general rule. The city plan appears to have a bias for 2-bedroom units, which it designates as “family units” – this may be an anachronism considering that 38% of city residents live alone and that SF has the lowest percentage of children of any major U.S. city. Of course, many singles and couples like to have a guest bedroom or home office.
However, in 2012, the city agreed to allow the construction of 375 “micro-units,” apartments of 220 to 300 square feet, including kitchen and bath. A few dozen have been built – one article mentioned a rental rate of $1850/month – and another 160 are under construction in the mid-Market area. It will be interesting to see how this trend develops (or doesn’t) in both the rental and for-sale markets. It might be a good match for the relatively young (but well paid), non-driving, high-tech workers pouring into the city.

New construction has been concentrated in a few specific districts of the city, mostly where higher density housing projects are most viable. “The ‘hot spot’ for much of this development is Market Street at various sections of it.”
The ability to take under-utilized commercial property sites and turn them into multi-unit or even high-rise residential projects is particularly prized: “There are 50 projects in the current pipeline database proposing demolition or conversion of existing [commercial] buildings to residential use.” “Nearly all units replacing office uses are in mid- to high-rise residential structures of 20 to 500 housing units in high density zoning districts. These projects are mostly concentrated in the eastern half of the city: Rincon Hill, East SoMa, Showplace Square & Potrero Hill, Transbay, Mission and Downtown.”

Three issues regarding new condo construction: the year in which a project is designated as “completed” in city reports can vary, depending on the department and the dating of events within the process (so this chart won’t perfectly tally with others). Secondly, some developers build and record the units as condos but then rent the units instead of selling them. Finally, new housing projects are now typically required to sell or rent about 15% of units under affordable-housing rules. All these factors affect how new condo construction impacts rental and sale markets.
“Single-family building construction made up a very small proportion of new construction in 2013 (1%).” Very few new houses are built in San Francisco, as developers prefer to build higher density housing projects on our limited supply of land. The houses that are built are typically big and expensive.
“Seventy-six percent of the condominium conversions in 2013 (279) were in buildings with two or three units.” The rules governing condo conversion in San Francisco are byzantine, politically-wrought and ever-changing, and the changes affect the ability to convert existing multi-unit properties and TICs into condominiums. Two-unit properties are much the easiest to convert into condos and accordingly enjoy a sale price premium.
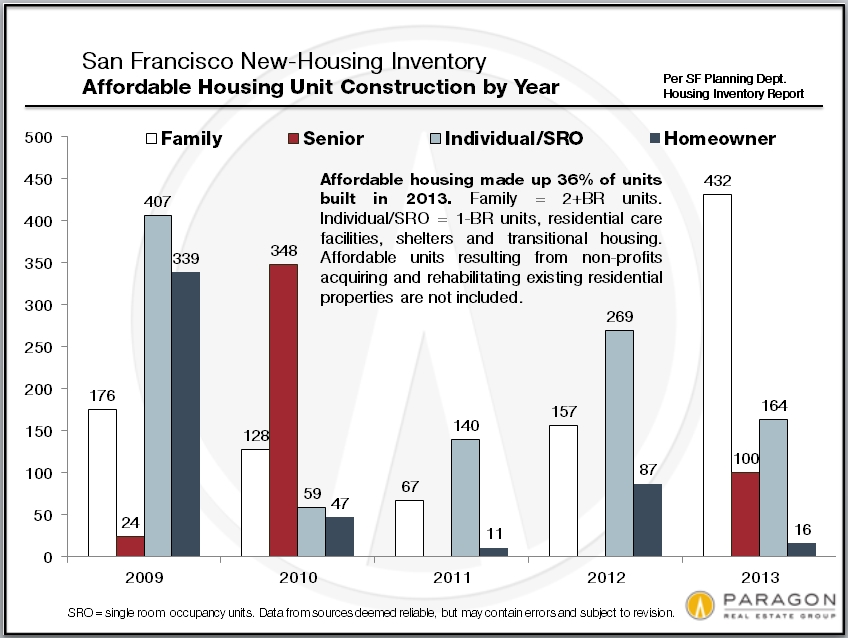
New housing typically conjures images of new condo developments, but it’s more complicated. Within new market-rate condo and apartment projects – rental housing construction has also been jumping with the recent large spikes in rents – typically 15% of units are required to be affordable housing: 220 of these “on-site” units were built in 2013. Add in social-project housing of one kind or another, and 36% of all new units built in 2013 were affordable housing. These units are allocated, rented and sold under rules and formulas pertaining to social and economic circumstances and housing cost.
“About 93% of the new affordable units are rentals affordable to very-low and low-income households.”
“Major affordable housing projects completed in 2013 include: 25 Essex Street (120 units); 701 Golden Gate Avenue (100 units); 474 Natoma Street (60 units); 1075 Le Conte Avenue (73 units); 60 West Point Road (54 units); and 61 West Point Road (13 units).”

This is another approximate snapshot of how general economic conditions affect new housing construction. When the financial markets crashed in 2008, new construction went into a tailspin due to demand and financing issues. As the economy has recovered, it has sprung back to life – as is clear by all the cranes stalking the city’s lots. Like most financial markets, real estate development has economic cycles – cycles that often include dramatic booms and crashes. This is exacerbated by the length of time between a developer’s initial plan and land purchase, and the completion of the project, which often runs to years. It can be difficult enough to predict what market conditions will be next month, much less in two, three or more years.

We created this chart in 2013 with data compiled from a variety to sources we deem reliable. All the numbers should be considered very approximate – and they are constantly changing – but the chart is generally representative of the existing housing breakdown in San Francisco.
This report was created in good faith and is based on data from sources deemed reliable,
but may contain inadvertent errors and misrepresentations, and is subject to revision.
© May 2014 Paragon Real Estate Group