Current SF Home Values by Neighborhood
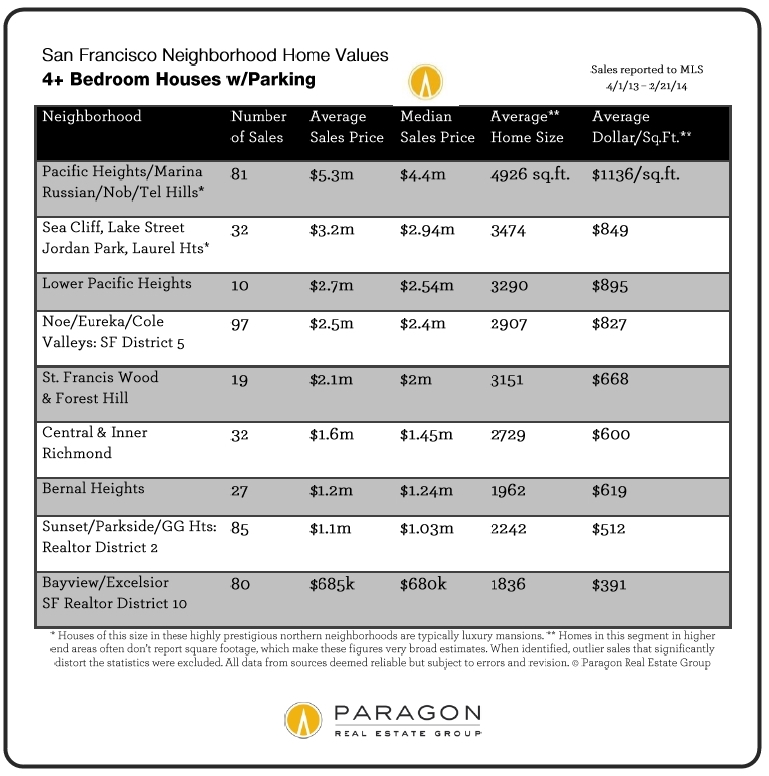
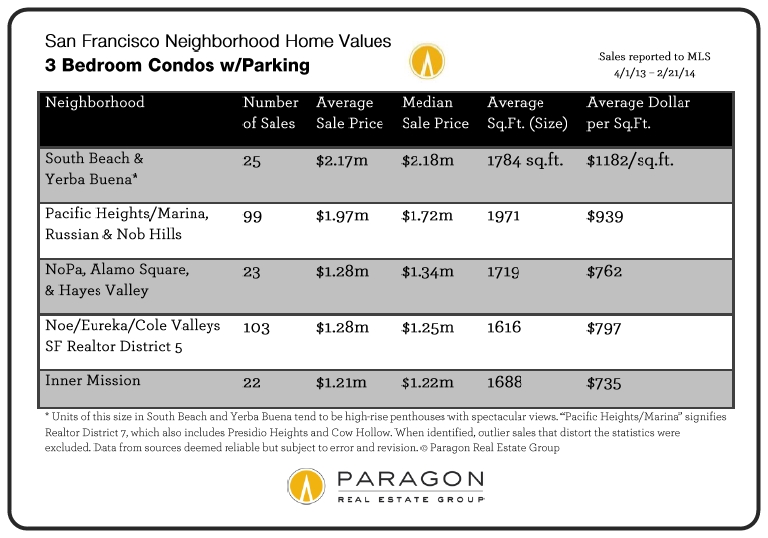
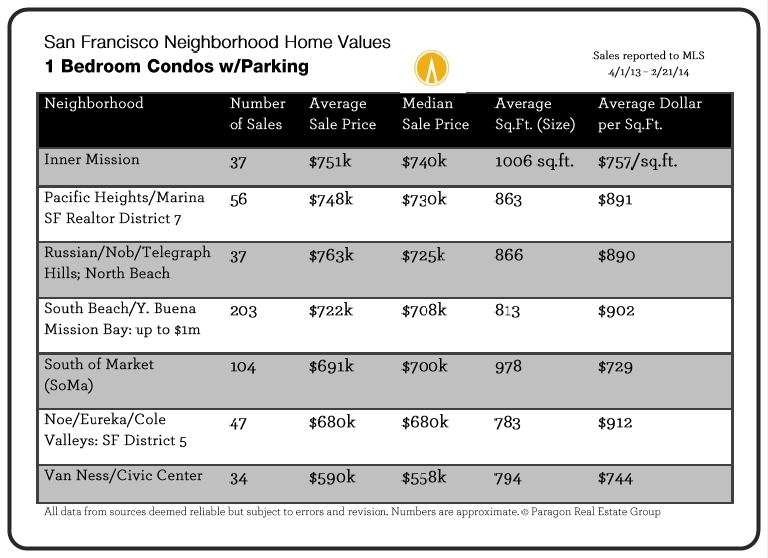
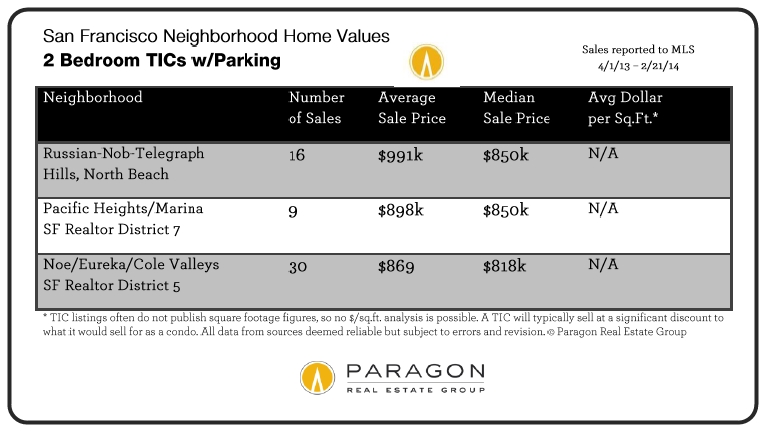
These tables report average and median sales prices and average dollar per square foot values, along with average home size and units sold, by property type and bedroom count for a wide variety of San Francisco neighborhoods. The tables follow the map in the following order: houses by bedroom count, condos by bedroom count, 2-bedroom TICs, and finally a small table on 2-unit building sales. The analysis is based upon sales reported to MLS between April 1, 2013, when the last big surge in home values began in San Francisco, and February 21, 2014. Value statistics are generalities that are affected by a number of market factors and all numbers should be considered approximate.
The “m” signifies millions of dollars; “k” signifies thousands; N/A means there wasn’t enough data for reliable results.
These statistics apply only to home sales with at least 1 car parking. Homes without parking typically sell at a significant discount. Below Market Rate (BMR) condos were excluded from the analysis.
The average size of homes vary widely by neighborhood. Besides affluence, the era and style of construction often play a large role in these size disparities. Some neighborhoods are well known for having “bonus” bedrooms and baths built without permit (often behind the garage). Such additions can add value, but being unpermitted are not reflected in square footage and $/sq.ft. figures.
If a price is followed by a “k” it references thousands of dollars; if followed by an “m”, it signifies millions of dollars. Sales unreported to MLS are not included in this analysis, and where abnormal “outliers” were identified that significantly distorted the statistics, these were deleted as well. N/A signifies that there wasn’t enough reliable data to generate the statistic.
The Median Sales Price is that price at which half the properties sold for more and half for less. It may be affected by “unusual” events or by changes in inventory and buying trends, as well as by changes in value. The median sale price for an area will often conceal a wide variety of sales prices in the underlying individual sales. Average sales prices may be distorted by one or two sales significantly higher or lower than the normal range. All numbers should be considered approximate.
Dollar per Square Foot is based upon the home’s interior living space and does not include garages, storage, unfinished attics and basements; rooms and apartments built without permit; decks, patios or yards. These figures are typically derived from appraisals or tax records, but can be unreliable, measured in different ways, or unreported altogether: thus consider square footage and $/sq.ft. figures to be very general approximations. Size and $/sq.ft. values were only calculated on listings that provided square footage figures. All things being equal, a house will have a higher dollar per square foot than a condo (because of land value), a condo’s will be higher than a TIC (quality of title), and a TIC’s higher than a multi-unit building’s (quality of use). All things being equal, a smaller home will have a higher $/sq.ft. than a larger one.
Many aspects of value cannot be adequately reflected in general statistics: curb appeal, age, condition, views, amenities, outdoor space, “bonus” rooms, parking, quality of location within the neighborhood, and so forth. Thus, how these statistics apply to any particular home is unknown without a specific comparative market analysis. Data is from sources deemed reliable, but may contain errors and is subject to revision.
District 1 (Northwest): Sea Cliff, Lake Street, Richmond (Inner, Central, Outer), Jordan Park/Laurel Heights, Lone Mountain
District 2 (West): Sunset & Parkside (Inner, Central, Outer), Golden Gate Heights
District 3 (Southwest): Lake Shore, Lakeside, Merced Manor, Merced Heights, Ingleside, Ingleside Heights, Oceanview
District 4 (Central SW): St. Francis Wood, Forest Hill, West Portal, Forest Knolls, Diamond Heights, Midtown Terrace, Miraloma Park, Sunnyside, Balboa Terrace, Ingleside Terrace, Mt. Davidson Manor, Sherwood Forest, Monterey Heights, Westwood Highlands
District 5 (Central): Noe Valley, Eureka Valley/Dolores Heights (Castro, Liberty Hill), Cole Valley, Glen Park, Corona Heights, Clarendon Heights, Ashbury Heights, Buena Vista Park, Haight Ashbury, Duboce Triangle, Twin Peaks, Mission Dolores, Parnassus Heights
District 6 (Central North): Hayes Valley, North of Panhandle (NOPA), Alamo Square, Western Addition, Anza Vista, Lower Pacific Heights
District 7 (North): Pacific Heights, Presidio Heights, Cow Hollow, Marina
District 8 (Northeast): Russian Hill, Nob Hill, Telegraph Hill, North Beach, Financial District, North Waterfront, Downtown, Van Ness/ Civic Center, Tenderloin
District 9 (East): SoMa, South Beach, Mission Bay, Potrero Hill, Dogpatch, Bernal Heights, Inner Mission, Yerba Buena
District 10 (Southeast): Bayview, Bayview Heights, Excelsior, Portola, Visitacion Valley, Silver Terrace, Mission Terrace, Crocker Amazon, Outer Mission
Some Realtor districts contain neighborhoods that are relatively homogeneous in general home values, such as districts 5 and 7, and others contain neighborhoods of wildly different values, such as district 8 which, for example, includes both Russian Hill and the Tenderloin.


